Reading a performance profile
A hands-on field guide to the two views that matter most: the network waterfall and the flame chart. Every figure below is interactive, click and toggle to build the mental models that make a trace quick to read.
The color language
In both the CPU overview and the flame chart, color encodes the kind of work, not the file. Learn these five categories and most of the panel starts to make sense.
When one color dominates, that's usually the bottleneck: a mostly-yellow profile is CPU-bound on JavaScript, the shape of the sample trace we use throughout this guide.
Anatomy of a network request
In the Network track, each request is one bar. Its shape tells you where the time went. Click a segment to inspect it, then switch the scenario to see how the same bar reshapes when the bottleneck changes.
Click a part of the bar
Each phase is selectable. In real DevTools, hover any bar for the exact breakdown (Queueing, DNS, Connect, SSL, Request sent, Waiting, Download) plus Priority and Initiator.
The waterfall tells a dependency story
Read the waterfall vertically. Bars that start at the same X were discovered together; a staircase means each request had to wait for the previous one. Toggle the two patterns.
A second wave of requests that starts only after a script executes was requested by that JS, not by the HTML. When something appears late, ask who initiated it: that is the lever.
The same, in real DevTools · Network
A real capture, annotated
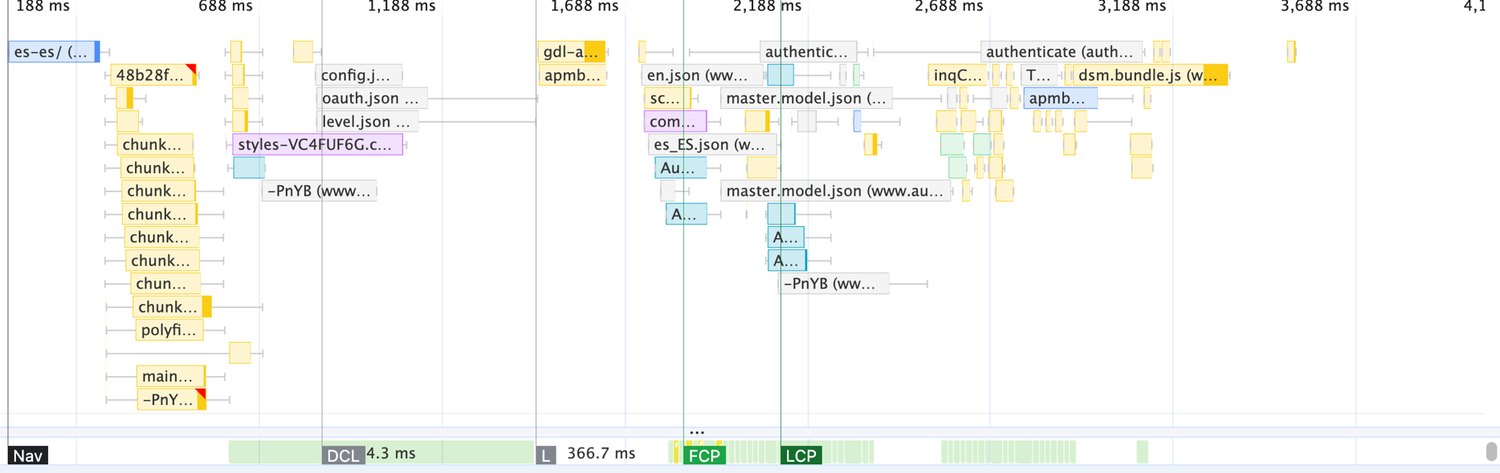
Hover or tap a row to spotlight it on the capture.
- A
The ~10 app bundles share one start X, the HTML referenced them together, so they download in parallel.
- B
The HTML document: the very first request. Everything else is discovered from it.
- C
config.json,oauth.json,level.json: three XHRs the app bundle fires during bootstrap, not something the HTML referenced; select a bar and the initiator arrow points back at the script that sent it. The pale boxes are TTFB, 240–305ms of waiting, and the payloads are ~2KB, so the download is too thin to see. The thin line trailing two of them is the finish tail: the bytes were already in, but a 350msloadhandler owned the main thread, so those responses sat in the queue ~300ms before the app could read them. - D
A second wave (
en.json,es_ES.json,master.model.json,authenticate) that starts only once the first wave has answered: a serial round trip, not a parallel one. - E
The stylesheet arrives late and at low priority (purple), well after the scripts.
- F
FCP and LCP (green) both land after the scripting wave, a JavaScript-gated paint.
The flame chart, decoded
Two axes trip everyone up at first. X is real time. Y is call-stack depth: each row is a function called by the row above it. Width is total time including children. Click any frame to read it.
Click a frame
Total time is the bar’s width. Self time is the part not covered by any child below it: that’s where the CPU actually burns.
Self vs total is the distinction to internalize: a fat bar with a fat child has almost no self time, the child is the culprit, not the parent. Toggle Show self time above to see each frame’s own work hatched.
The Timings track: line up your own milestones
Above the flame chart, the Timings track holds the browser's own markers, FCP, LCP, DCL, and onload, so you can read what executed before each one. Add your own with performance.mark() and performance.measure(): the labels land right there in the track, so instead of guessing which block is your route change or data fetch, you read it straight off the timeline.
Initiators: reading the arrows
Select an event and DevTools draws arrows to what scheduled it and what it schedules next. A setInterval re-arms itself, so its firings chain across the timeline. Click a firing.
setInterval(fn, ~400 ms) firing repeatedly: each firing is its own Task; the arrows link each one to the next.In real DevTools


setInterval (unknown) under [unattributed]: 8.9 ms, all self time.Not everything is on the main thread
The flame chart above reads the Main thread, where most work piles up. But a capture has parallel tracks, and a frame on another thread is work that is not blocking your interactions. Which track owns a frame tells you where the fix lives.
| Track | What runs there |
|---|---|
| Main | Your JS, style, layout, and paint setup: almost everything in this guide. The thread every interaction competes for. |
| Worker | Web and Service Worker JS: parsing, sync, caching, off-main-thread compute. A frame here is work you already moved off Main. |
| Raster · Compositor | Turning paint commands into pixels and assembling layers. Compositor-only animations (transform, opacity) live here, not on Main. |
| GPU | The GPU process drawing the final frame to the screen. |
That is what the Animations & compositing section is about: moving work off Main onto the compositor. When Main is jammed, always ask whether the work could live on one of these other threads instead.
The same, in real DevTools · Flame chart
A real capture, annotated
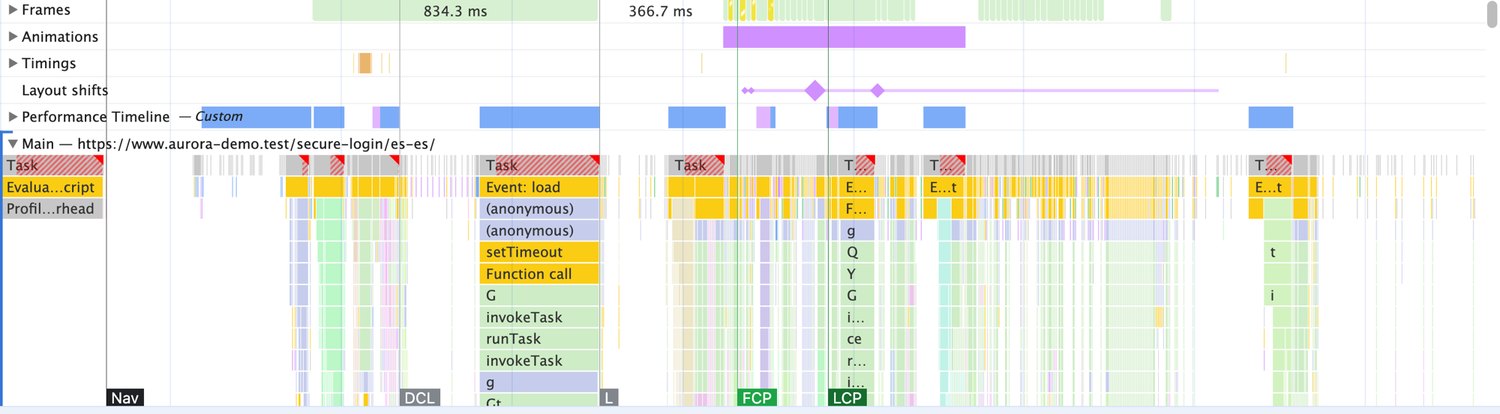
Hover or tap a row to spotlight it on the capture.
- A
Task rows with a red hatched corner are long tasks (>50 ms), the thread is blocked for their whole width.
- B
Evaluate script/Event: load(yellow) = the bundles executing at the top level. - C
invokeTask · runTask= Zone.js internals, a framework running change detection. - D
Layout Shifts: the diamonds are CLS events, firing as the page settles.
- E
Frames: an 834 ms frame = a stalled thread. Long frames are the jank users feel.
- F
The LCP marker cuts through a scripting task, the largest paint waits on JavaScript.
One dataset, three views
The Flame chart, Call tree and Bottom-up are the same samples, aggregated differently. This is the exact tree from the flame chart above; switch between them to see what each view surfaces.
The flame chart's widest bars (Task, Evaluate Script) are mostly their children. Bottom-up, sorted by self time, surfaces the real cost, detectChanges and process, buried deep and invisible from the top. That gap is why I open Bottom-up first.
The same three views, in real DevTools
Bottom-up & Call tree, for real
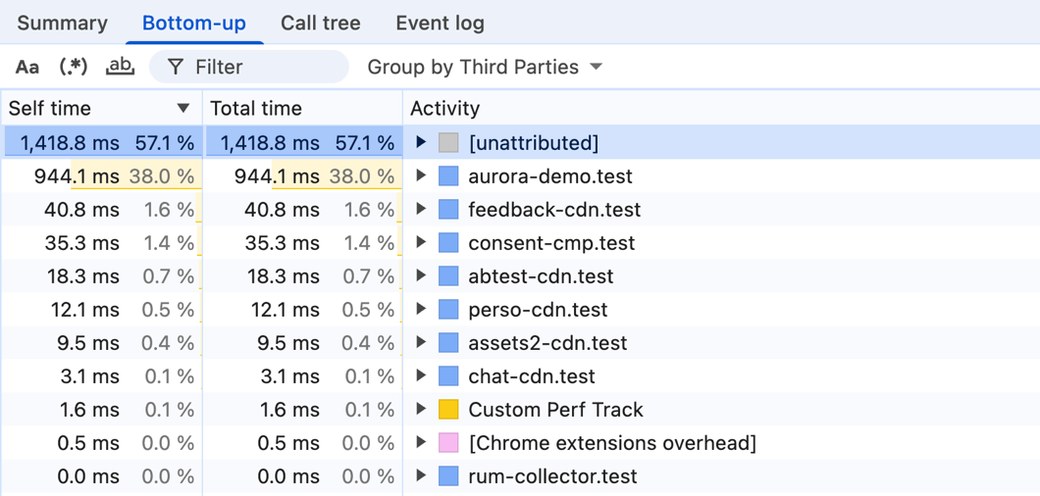
[unattributed] work is 57%; first-party JS (aurora-demo.test) is 944 ms / 38% of the main thread, the real cost. Third parties are tiny. Expand any row to drill into functions.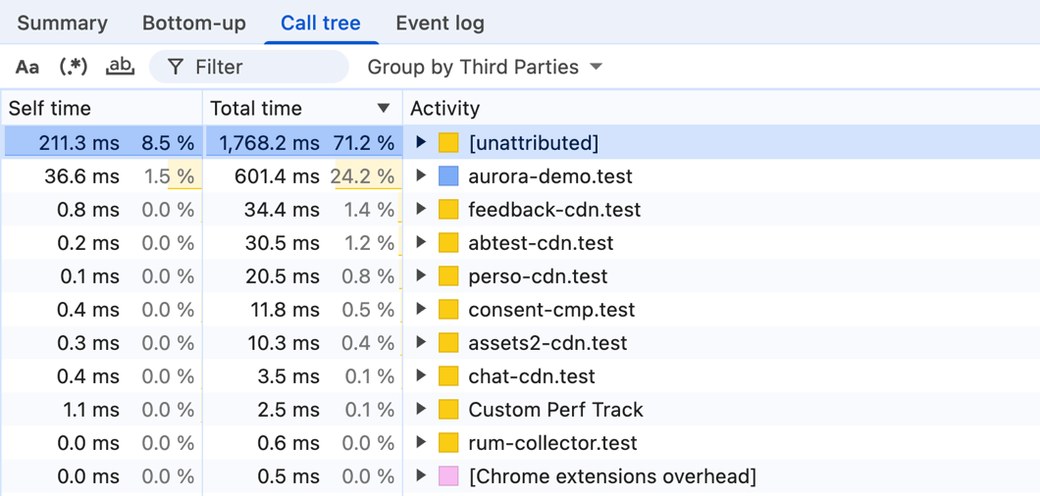
[unattributed] holds 71% of total, the mirror of Bottom-up's self-time view.The master diagnosis: CPU-bound or network-bound?
Line the network track up against the main thread. If the thread is idle waiting on a bar, you have a network problem. If it’s solid with work while nothing downloads, it’s a CPU problem. Flip between the two.
CPU-bound
JS is fully downloaded by ~700 ms, but the main thread stays solid yellow until FCP at 1.85 s. The fix is on the CPU side: less JS to execute, code-splitting, deferring the bootstrap, not faster downloads.
LCP & the four phases
The trio's loading metric. LCP (Largest Contentful Paint) marks when the biggest element in the viewport, usually the hero image or headline, finishes painting. The panel splits it into four phases, and the one that dominates tells us whether the fix is on the network or the main thread.
It comes down to one split: did the resource arrive late (load delay + load time), or did the render arrive late (render delay)? Thresholds: good ≤ 2.5 s, needs work ≤ 4 s, poor > 4 s. In the panel, the LCP marker sits in the Timings track; hover it to highlight the element. You don’t estimate these sub-parts by hand: open the Insights sidebar and the LCP by phase insight breaks the metric into exactly these four sub-parts, while LCP request discovery flags a resource the browser found too late.
Frames & layout shifts (CLS)
Two more overview tracks cover visual stability. Frames shows every painted frame: uniform green is smooth, a fat block is a stalled thread. Layout Shifts marks content jumping, the raw material of CLS.
Watch a layout shift happen
CLS 0.00
Nothing has shifted yet. Load the late image and watch the “Pay now” button jump under your finger.
CLS = impact fraction × distance fraction, summed within a session window. The cure is boring: reserve the space (width/height, aspect-ratio) so late content lands without pushing anything.
INP & interactions
Where LCP covers loading, INP (Interaction to Next Paint) measures whether the page responds, from a tap to the next painted frame. It splits into three phases, and usually one of them drags the rest.
Feel it: click the button
Thresholds: good ≤ 200 ms, needs work ≤ 500 ms, poor > 500 ms. In the panel, open the Interactions track to see each interaction's three phases, then attribute the processing block to a handler in Bottom-up. Scroll jank is the same story: long tasks stealing the frame budget while you scroll. When there is no real interaction to measure, Total Blocking Time stands in for INP in the lab: the blocking part of every task past 50 ms, summed. Drive TBT down and INP usually follows.
Animations & compositing
The Animations track (purple) lists every property a CSS transition or @keyframes animates. One question decides whether it is cheap: is it composited? Composited animations run on the compositor, off the main thread, and stay smooth even under load. Everything else recomputes layout or paint every frame, and DevTools marks it Compositing failed.
Composited-safe: transform, opacity, and filter. Animating anything that changes box size or pixels (width, margin, top/left, box-shadow, color) forces the main thread to work each frame. Select an animation in the panel and read the Compositing failed reason in Summary; the fix is almost always to move it to transform/opacity.
Recalculate Style, Layout & the render pipeline
Whenever styles change, the browser runs a fixed pipeline before the screen updates: Recalculate Style → Layout → Paint → Composite. On Main each stage is its own event; reading them tells you what changed, how much it cost, and whether it stole the frame. Click a stage, and switch what triggered it.
The event's Initiated by tells you where the recalc came from, here a Parse stylesheet (guide.css) finishing and invalidating the page. Read Elements affected on Recalculate Style, and Nodes that need layout / Layout root on Layout: a root of #document with hundreds of nodes is a page-wide reflow. When Recalc + Layout run long they turn the Task into a long task that blocks the main thread, so a tap landing on it waits, and that delay lands in INP.
The expert reading workflow
I never read a flame chart cold. This is the order I actually work a capture in.
Before you record: the pre-flight
A reading is only as trustworthy as its capture. Set these before you hit record, or every conclusion below inherits the error.
| Setting | Why it matters |
|---|---|
| CPU throttle 4–6× | Your dev machine is far faster than a real phone. Without it, long tasks shrink and you miss the very jank users feel. |
| Network throttle | Match a real connection (Slow / Fast 4G). It reshapes the waterfall and moves when LCP actually lands. |
| Clean profile / incognito | Extensions inject their own scripts and long tasks. Capture without them or you profile the extensions, not your site. |
| Disable cache | Tick it for the first-visit story; a warm cache hides the real loading cost. Leave it on for the repeat-visit story. |
| Screenshots on | The filmstrip lets you line each metric up with what the user actually saw on screen. |
| Recording mode | Reload for a load profile; wrap record / stop around a click or scroll for an interaction (INP) profile. Match it to your question. |
- Capture like your users
Get the pre-flight above right first: throttling, a clean profile, the recording mode that matches your question. A fast desktop hides the very jank your users feel.
- Scope the range
Drag-select from
NavtoLCPin the overview. Everything below recomputes to that window. - Summary, then Insights
Read the category pie: mostly Scripting → CPU-bound, mostly Loading → network/parse. Then let the Insights sidebar triage for you: LCP by phase, render-blocking requests, forced reflow, DOM size, duplicated JS. It turns reading into a checklist.
- Bottom-up by self time
Sort functions by self time, group by URL. The top row is your offender and its owner (1st vs 3rd party). This is the flame graph proper.
- Walk the long tasks
Every red-cornered task >50 ms: click, read the stack, attribute it, and follow its initiator to the real cause.
- Cross-check the network
Is the thread idle against a bar (network) or busy while nothing loads (CPU)? Confirm the diagnosis.
- Read under the markers
What executes beneath the FCP/LCP lines, and check Frames & Layout Shifts for jank and CLS.
- Verify the fix
Record before, change one thing, record after, and compare. Confirm the metric you targeted actually moved; a greener flame chart that did not move LCP or INP fixed nothing.
Pro habits
- Dim or ignore third parties to see only the code you own; add noisy frames to the ignore list and the flame chart collapses to what matters.
- Glance at the Thread pool and GPU tracks: work there is already off the main thread, so it is rarely your INP problem.
- Save the trace (the download icon) to diff two runs, share a repro, or reload it later; a profile is a document, not a moment.
The Insights sidebar: your triage checklist
Recent Chrome folded Performance Insights into the panel. The Insights sidebar runs these checks on your trace automatically and ranks them by estimated savings, so the first pass is a checklist, not a hunt. The ones you will lean on:
| Insight | What it flags | Where it points |
|---|---|---|
| LCP by phase | Which of the four LCP phases dominates the metric | The resource-late vs render-late split; see the LCP section. |
| LCP request discovery | The LCP image was found late or not prioritized | Preload it and set fetchpriority="high". |
| Render-blocking requests | CSS or JS that delays the first paint | Defer or inline it; read the waterfall for the chain. |
| Network dependency tree | Long chains of critical requests | Flatten the chain, preconnect to key origins. |
| Document request latency | Slow TTFB, redirects, or missing compression | Backend and CDN, not the front end. |
| Forced reflow | JavaScript reading layout right after writing it | Batch reads before writes; see Recalculate & Layout. |
| DOM size | A DOM large enough to slow style and layout | Trim and flatten nodes; see Recalculate & Layout. |
| Layout shift culprits | The exact elements that moved | Reserve their space; see Frames & CLS. |
| Third parties | How much load time third-party code costs | Defer and prune; see Request signatures. |
| Duplicated JavaScript | The same module shipped more than once | Dedupe the bundles; attribute it in Bottom-up. |
Each insight estimates the metric it would save, so you triage by impact: open the biggest one, read its detail, then jump to the flagged event in the flame chart. It is the fastest way into a trace you have never seen.
Reading function-name signatures
Recognize code by its frame names, then attribute it by URL in Bottom-up. Filter by where the code lives; a few we meet constantly:
| Frames you see | What it is | So what |
|---|---|---|
| Frameworks & app code | ||
| performUnitOfWork · beginWork · commitRoot | React reconciler | Render then commit. Long here means big re-renders; memoize and split state. |
| workLoopSync · flushWork · performWorkUntilDeadline | React Scheduler | The time-slicing loop; bursts under interactions. Check what scheduled the update. |
| invokeTask · runTask · drainMicroTaskQueue · Zone | Zone.js (Angular) | Change detection wrapping every callback. |
| patch · flushJobs · reactiveEffect | Vue reactivity | Re-render from reactive deps; long means a wide reactive graph. |
| hydrateRoot · hydrate · commitRoot | SSR hydration | The cost of making server HTML interactive, a classic “slow before interactive” INP trap. |
| jQuery.fn.init · dispatch · handle | jQuery events | Legacy event handling, often buried in old plugins. |
| Third-party | ||
| gtag · ga · (gtm.js) | Google Analytics / Tag Manager | Tags firing on load and on interaction; defer and prune them. |
| AppMeasurement · s.t · s.tl | Adobe Analytics (AppMeasurement) | Beacon fires on load and on each tracked link; batch calls and defer the non-critical ones. |
| _satellite · satelliteLib · getVar | Adobe Launch / DTM (tag manager) | Rules engine that injects other tags; long here means a heavy rule fired on load or interaction. |
| __tcfapi · OneTrust · Cookiebot · Didomi | Consent management (CMP) | Often gates everything until consent resolves; load it lean and early. |
| mbox · at.js · adobe.target | Adobe Target (A/B & personalization) | Can block render to avoid flicker; a slow mbox delays LCP and the first paint. |
| optimizely · activate · _vwo_$ | A/B testing & experiments (Optimizely, VWO) | Anti-flicker snippets hide the page until they resolve; watch for blocked paints. |
| fbq · fbevents | Meta Pixel (conversion tracking) | Fires on load and on custom events; defer until after the page is interactive. |
| hj · _hjSettings · FS · clarity | Session replay & heatmaps (Hotjar, FullStory, Clarity) | Records DOM mutations and input; a steady main-thread cost on interaction-heavy pages. |
| analytics.track · analytics.page | Customer data platform (Segment) | Fan-out layer that feeds many destinations; one call multiplies into downstream work. |
| Intercom · zE · drift | Chat & support widget | Loads its own late bundle and fonts; a large deferred payload, often self-inflicted INP. |
| googletag · defineSlot · pubads | Ad tech (GPT) | Slot setup and refresh; long tasks plus layout shift. |
| processDNA · loadFlash · newColFunc | Device fingerprinting / anti-bot | Akamai/BioCatch-style sensor. Heavy, deferrable. |
| Browser & runtime | ||
| Evaluate Script · Compile Code · (anonymous) | Top-level module execution | Bootstrap cost. Attribute by URL in Bottom-up. |
| Recalculate Style · Layout | Rendering (purple) | Style and reflow; layout thrashing if interleaved with script in a loop. |
| Parse HTML · Parse Stylesheet | Loading & parse | Big DOM or CSS; Parse Stylesheet is what feeds Recalculate Style. |
| Function Call → setTimeout / requestAnimationFrame | Scheduled work | Timer-driven tasks; common INP offenders. Trace the initiator. |
| Minor GC · Major GC | Garbage collection (V8) | Memory pressure; frequent Major GC means allocation churn. |
| JSON.parse | Deserialization | Large state or hydration payloads parsed on the main thread. |
Don’t recognize a stack? Group Bottom-up by URL to see the owner (1st vs 3rd party), or right-click a frame and Add script to ignore list to collapse code you don’t own. The frame name plus its owner is usually enough to place the cost.
Reading request signatures
Frame names identify code in the flame chart; request origins identify it in the waterfall. Recognize the vendor by domain, then judge it by where the request sits: on the critical path, render-blocking, or a spare connection you can safely defer. Filter by what the request does:
| Domain you see | What it is | So what |
|---|---|---|
| Analytics & tags | ||
| googletagmanager.com · google-analytics.com | Google Tag Manager / GA4 | GTM loads early then injects child tags; load it async and audit what it pulls in, the container is only as light as its tags. |
| assets.adobedtm.com · *.omtrdc.net · *.demdex.net | Adobe (Launch, Analytics, Audience Manager) | demdex/omtrdc do ID-sync and beacons on separate origins; preconnect if they gate personalization, otherwise defer. |
| cdn.segment.com · api.segment.io | Segment (CDP) | Loads analytics.js then fans out to destinations; one snippet multiplies into many requests, so watch the cascade. |
| Consent (CMP) | ||
| cdn.cookielaw.org · geolocation.onetrust.com | OneTrust | Often gates other tags until consent resolves; it sits on the critical path, so load it early and lean. |
| consent.cookiebot.com · consentcdn.cookiebot.com | Cookiebot | Same gate pattern; a slow CMP response delays everything downstream, including analytics and pixels. |
| sdk.privacy-center.org · app.usercentrics.eu | Didomi / Usercentrics | Render-blocking if loaded sync; confirm the banner script isn’t holding the first paint. |
| Experiments / A-B | ||
| cdn.optimizely.com · logx.optimizely.com | Optimizely | Anti-flicker snippet hides the page until it decides; measure the hidden time against LCP. |
| dev.visualwebsiteoptimizer.com | VWO | Same synchronous hide pattern; a slow response stalls the paint for every visitor. |
| *.tt.omtrdc.net · at.js | Adobe Target | mbox calls can block render to avoid flicker; keep the mbox round-trip off the critical path where you can. |
| Marketing pixels | ||
| connect.facebook.net · facebook.com/tr | Meta Pixel | Loads fbevents.js then fires /tr beacons; defer until after interactive, it rarely needs to be early. |
| analytics.tiktok.com · static.ads-twitter.com | TikTok / X pixels | Conversion beacons; none are on the critical path, so batch and delay them. |
| bat.bing.com · googleads.g.doubleclick.net | Bing / Google Ads | Remarketing tags, often duplicated via GTM; prune the duplicates and load late. |
| Session replay | ||
| static.hotjar.com · script.hotjar.com | Hotjar | Loads a recorder plus settings; a steady main-thread cost, sample or disable it on heavy pages. |
| edge.fullstory.com · rs.fullstory.com | FullStory | Records DOM mutations continuously; a persistent CPU tax during interaction, watch INP. |
| *.clarity.ms | Microsoft Clarity | Same recorder pattern; lighter, but still uploads on interaction and adds listeners. |
| Media & embeds | ||
| youtube.com/embed · i.ytimg.com · *.googlevideo.com | YouTube embed | Pulls an iframe, player JS, and thumbnails; use a facade (lite embed) that loads the player only on click. |
| player.vimeo.com · f.vimeocdn.com | Vimeo embed | Same iframe weight; facade or lazy-load it below the fold. |
| maps.googleapis.com · maps.gstatic.com | Google Maps | Heavy JS plus map tiles; show a static map image and load the interactive map on interaction. |
| Fonts & CDN | ||
| fonts.googleapis.com · fonts.gstatic.com | Google Fonts | CSS on one origin, files on another; preconnect to gstatic or self-host to cut two extra hops. |
| use.typekit.net · p.typekit.net | Adobe Fonts (Typekit) | Blocking CSS that then fetches font files; preload the CSS and set a fallback to avoid FOIT. |
| cdn.jsdelivr.net · unpkg.com · cdnjs.cloudflare.com | Public JS/CSS CDNs | A third-party origin on the critical path; self-host critical libs to drop the extra connection. |
| Payments | ||
| js.stripe.com · m.stripe.network | Stripe | Loads Stripe.js and background fraud signals; only load it on checkout, not site-wide. |
| paypal.com/sdk/js · paypalobjects.com | PayPal SDK | A large SDK; gate it behind the cart/checkout route, not the global bundle. |
| google.com/recaptcha · gstatic.com/recaptcha | reCAPTCHA | Loads on every page if included globally; scope it to the forms that actually need it. |
In the Network panel, add the Domain column (right-click the header) or the 3rd-party filter to group these in one pass; in the Performance panel, hover a network bar to read its URL. Origin plus purpose is usually enough to attribute a request.
Interactive field guide for reading the Chrome DevTools Performance panel. The interactive figures are stylized recreations for teaching; the real DevTools screenshots come from a synthetic client-side-rendered login SPA captured for this guide. Colors follow the panel’s activity categories.